
Last modified on 01 Oct 2021.
Introduction
In this challenge, we are going to answer the question: “What sorts of people were more likely to survive?” using passenger data. Datasets to be used: train.csv (for training and predicting), test.csv (for submitting).
 –
– ![]()
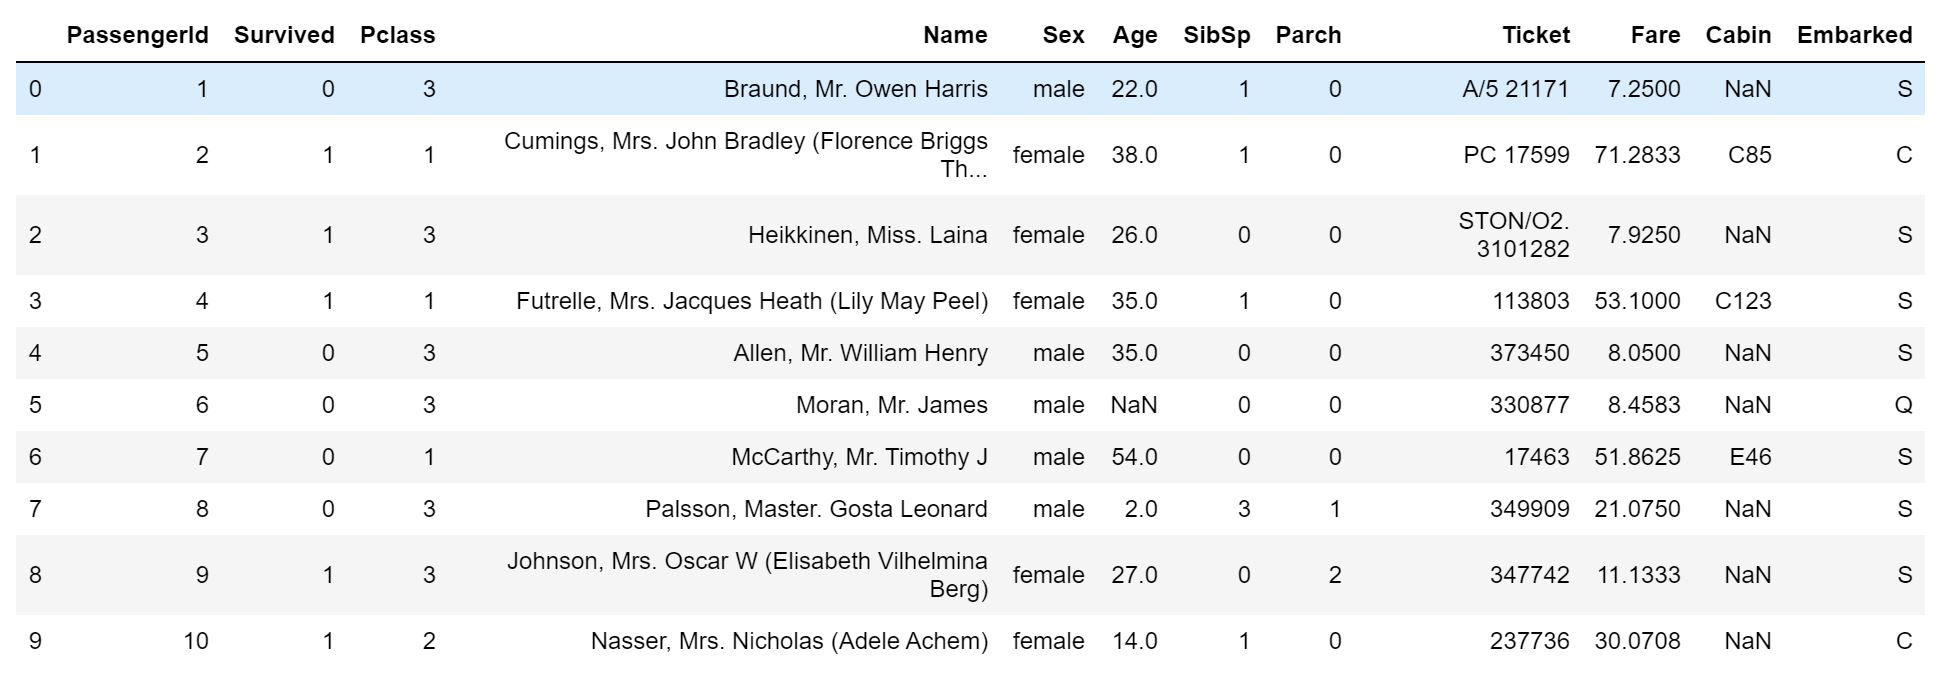 First 10 rows of the dataset.
| Variable | Definition | Key |
|---|---|---|
| survival | Survival | 0 = No, 1 = Yes |
| pclass | Ticket class | 1 = 1st, 2 = 2nd, 3 = 3rd |
| sex | Sex | |
| Age | Age in years | |
| sibsp | # of siblings / spouses aboard the Titanic | |
| parch | # of parents / children aboard the Titanic | |
| ticket | Ticket number | |
| fare | Passenger fare | |
| cabin | Cabin number | |
| embarked | Port of Embarkation | C = Cherbourg, Q = Queenstown, S = Southampton |
TL;DR;
- Take an overview about dataset.
.describefor numerical / categorical features.- Find percentage of missing data on each feature.
- Survival based on some categorical features.
- Visualize survival based on
Age. - Check if the result depends on the titles indicated in the
Name?
- Preprocessing data:
- Drop unnecessary features (columns) (
Name,Ticket,Cabin) usingdf.drop(). - Convert categorical variables to dummy ones using
pd.get_dummies(). - Impute missing continuous values using
sklearn.impute.SimpleImputer. - Take an idea to change
Ageto a categorical feature and then also convert to dummy.
- Drop unnecessary features (columns) (
- Using
GridSearchCVto find the optimal hyper parameters and apply some algorithms, e.g. Random Forest. - Export the result to an output file.
Preliminaries
import numpy as np
import matplotlib.pyplot as plt # plot
import pandas as pd # working with dataset

from sklearn import preprocessing
from sklearn.impute import SimpleImputer # impute missing data

from sklearn.model_selection import GridSearchCV, cross_val_score
Overview datasets
Read data
train = pd.read_csv("train.csv")
test = pd.read_csv("test.csv")
Take a look
train.head(10)
train.info()
train.info()
train.describe() # for numerical features
train.describe(include=['O']) # for categorical features
Find the percentage of missing data on each feature,
total = train.isnull().sum().sort_values(ascending=False)
percent = (round(train.isnull().sum()/train.isnull().count()*100, 1)).sort_values(ascending=False)
pd.concat([total, percent], axis=1, keys=['Total', '% of missing'])
Survival based on some categorical features,
train.pivot_table(index="Sex", values="Survived")
train.pivot_table(index="Pclass", values="Survived")
train.pivot_table(index="SibSp", values="Survived")
train.pivot_table(index="Parch", values="Survived")
Visualize survival based on Age (numerical),
train[train["Survived"]==1]['Age'].plot.hist(alpha=0.5, color='blue', bins=50) # survived
train[train["Survived"]==0]['Age'].plot.hist(alpha=0.5, color='blue', bins=50) # died
List of titles (Mr., Mrs., Dr.,…) from Name,
train.Name.str.extract(' ([A-Za-z]+)\.', expand=False)
Preprocessing data
In this task, you have to do the same techniques for both train and test sets!
Drop unnecessary features
Drop some unnecessary features (columns),
train.drop(['Name', 'Ticket', 'Cabin'], axis=1, inplace=True)
test.drop(['Name', 'Ticket', 'Cabin'], axis=1, inplace=True)
Convert to dummy
Convert categorical features to dummy variables,
def create_dummies(df, column_name):
  # Convert the column_name training feature into dummies using one-hot
  #   and leave one first category to prevent perfect collinearity
  dummies = pd.get_dummies(df[column_name], prefix=column_name, drop_first=True)
  df = pd.concat([df, dummies], axis=1)
  return df
# Sex
train = create_dummies(train, 'Sex')
test = create_dummies(test, 'Sex')
# Embarked
train = create_dummies(train, 'Embarked')
test = create_dummies(test, 'Embarked')
# Social Class
train = create_dummies(train, 'Pclass')
test = create_dummies(test, 'Pclass')
Impute Missing Values
For continuous variables, we wanna fill missing data with the mean value.
def impute_data(df_train, df_test, column_name):
  imputer = SimpleImputer(missing_values=np.nan, strategy='mean', verbose=0)
  # Fit the imputer object on the training data
  imputer.fit(df_train[column_name].values.reshape(-1, 1)) # transform single column to 1
  # Apply the imputer object to the df_train and df_test
  df_train[column_name] = imputer.transform(df_train[column_name].values.reshape(-1, 1))
  df_test[column_name] = imputer.transform(df_test[column_name].values.reshape(-1, 1))
  return df_train, df_test
# Age
train, test = impute_data(train, test, 'Age')
# Fare
train, test = impute_data(train, test, 'Fare')
Continuous to categorical
In the case, for example, you wanna convert Age feature which is initially a numerical feature to a categorical feature (many ranges of ages, for example).
def process_age(df, cut_points, label_names):
    df["Age"] = df["Age"].fillna(-0.5)
    df["Age_categories"] = pd.cut(df["Age"], cut_points, labels=label_names)
    return df

cut_points = [-1, 0, 5, 12, 18, 35, 60, 100]
label_names = ["Missing", 'Infant', "Child", 'Teenager', "Young_Adult", 'Adult', 'Senior']

train = process_age(main, cut_points, label_names)
test = process_age(test, cut_points, label_names)
Convert to a dummy variable,
main = create_dummies(main, 'Age_categories')
test = create_dummies(test, 'Age_categories')
Training with Random Forest
We will use Grid Search to test with different parameters and then choose the best ones.
# Create a dictionary containing all the candidate values of the parameters
parameter_grid = dict(n_estimators=list(range(1, 5001, 1000)),
                      criterion=['gini','entropy'],
                      max_features=list(range(1, len(features), 2)),
                      max_depth= [None] + list(range(5, 25, 1)))

# Creata a random forest object
random_forest = RandomForestClassifier(random_state=0, n_jobs=-1)

# Create a gridsearch object with 5-fold cross validation, and uses all cores (n_jobs=-1)
clf = GridSearchCV(estimator=random_forest, param_grid=parameter_grid, cv=5, verbose=1, n_jobs=-1)
Split into X_train, y_train:
X_train = train[train.columns.difference(['Survived'])]
y_train = train['Survived']
# Nest the gridsearchCV in a 3-fold CV for model evaluation
cv_scores = cross_val_score(clf, X_train, y_train)

# Print results
print('Accuracy scores:', cv_scores)
print('Mean of score:', np.mean(cv_scores))
print('Variance of scores:', np.var(cv_scores))
Retrain The Random Forest With The Optimum Parameters
# Retrain the model on the whole dataset
clf.fit(X_train, y_train)
# Predict who survived in the test dataset
predictions = clf.predict(test)
Create an output file
final_ids = test["PassengerId"]
submission_df = {"PassengerId": final_ids,
                 "Survived": predictions}
submission = pd.DataFrame(submission_df)

submission.to_csv('titanic_submission.csv', index=False)
Another way, check the last section of this post.
Other approaches
- Based on the number of family/sibling members: combination of
SibSpandParch. - Go alone?
- Consider the title from
Name. - Use Decision Tree with K-fold.
References
- Chris Albon – Titanic Competition With Random Forest.
- Manav Sehgal – Titanic Data Science Solutions.
- Dataquest – Kaggle fundamental – on my Github.
- Abhinav Sagar – How I scored in the top 1% of Kaggle’s Titanic Machine Learning Challenge.