Last modified on 01 Oct 2021.
What?
- Mean-Shift assigns the data points to the clusters iteratively by shifting points towards the mode (mode is the highest density of data points in the region, in the context of the Meanshift)
- Non-Parametric Density Estimation.
-
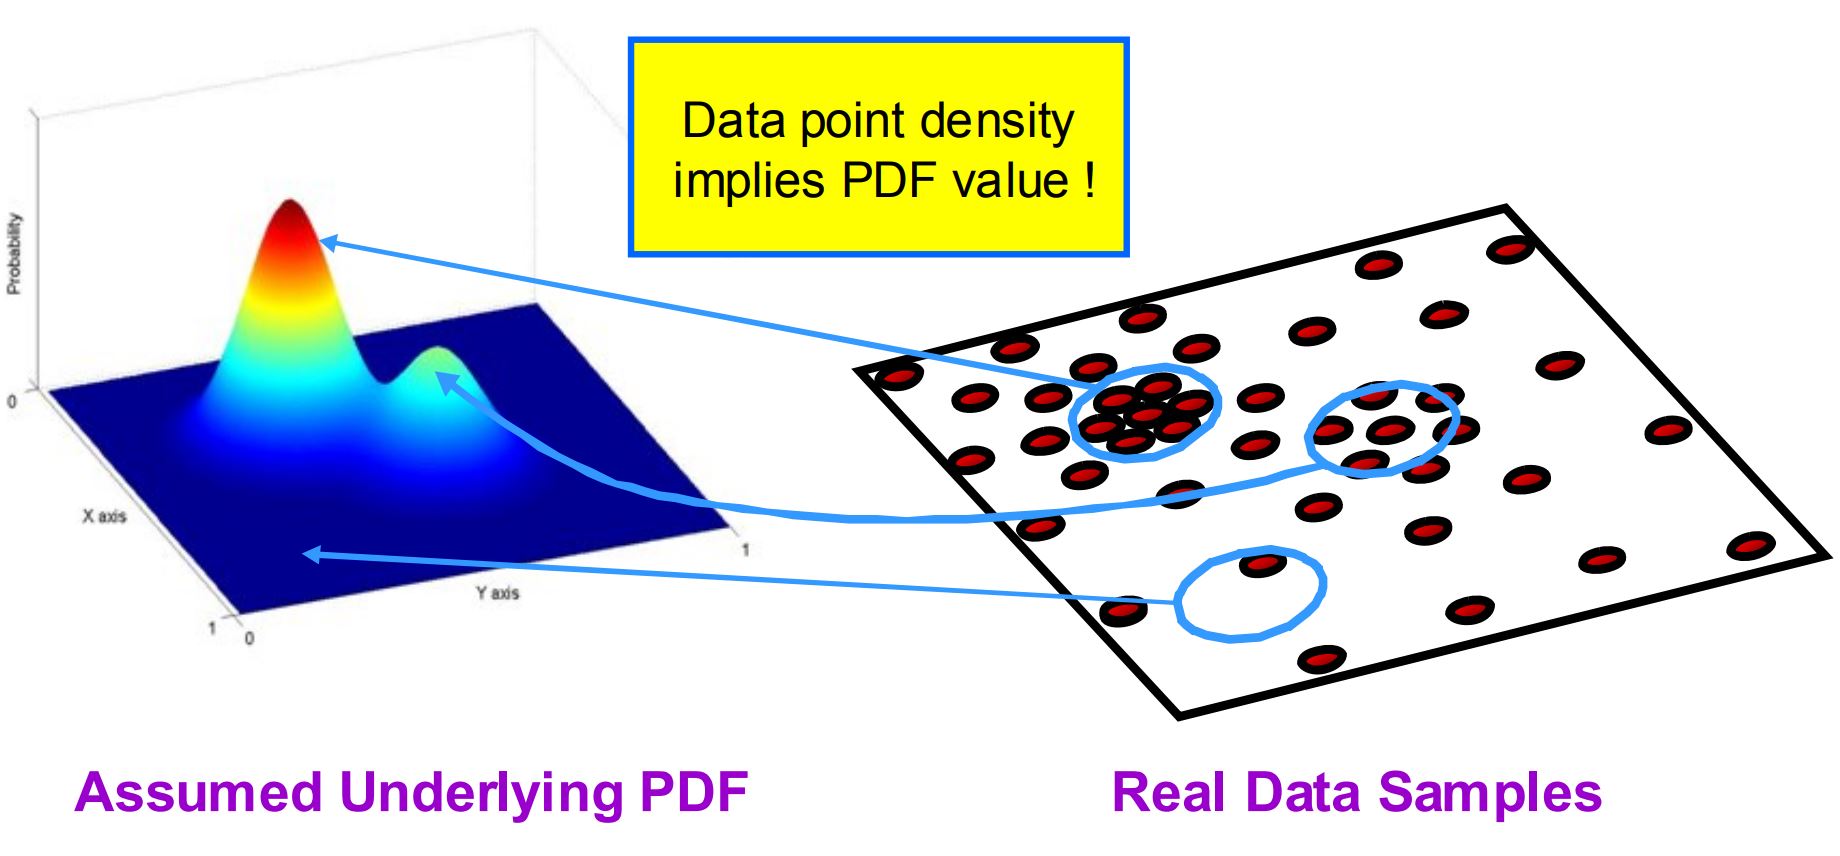
The data points are sampled from an underlying PDF (Probability density function)[ref] .
 Data point density implies PDF.
 - Mean-shift built based on the idea of Kernel Density Estimation.
-
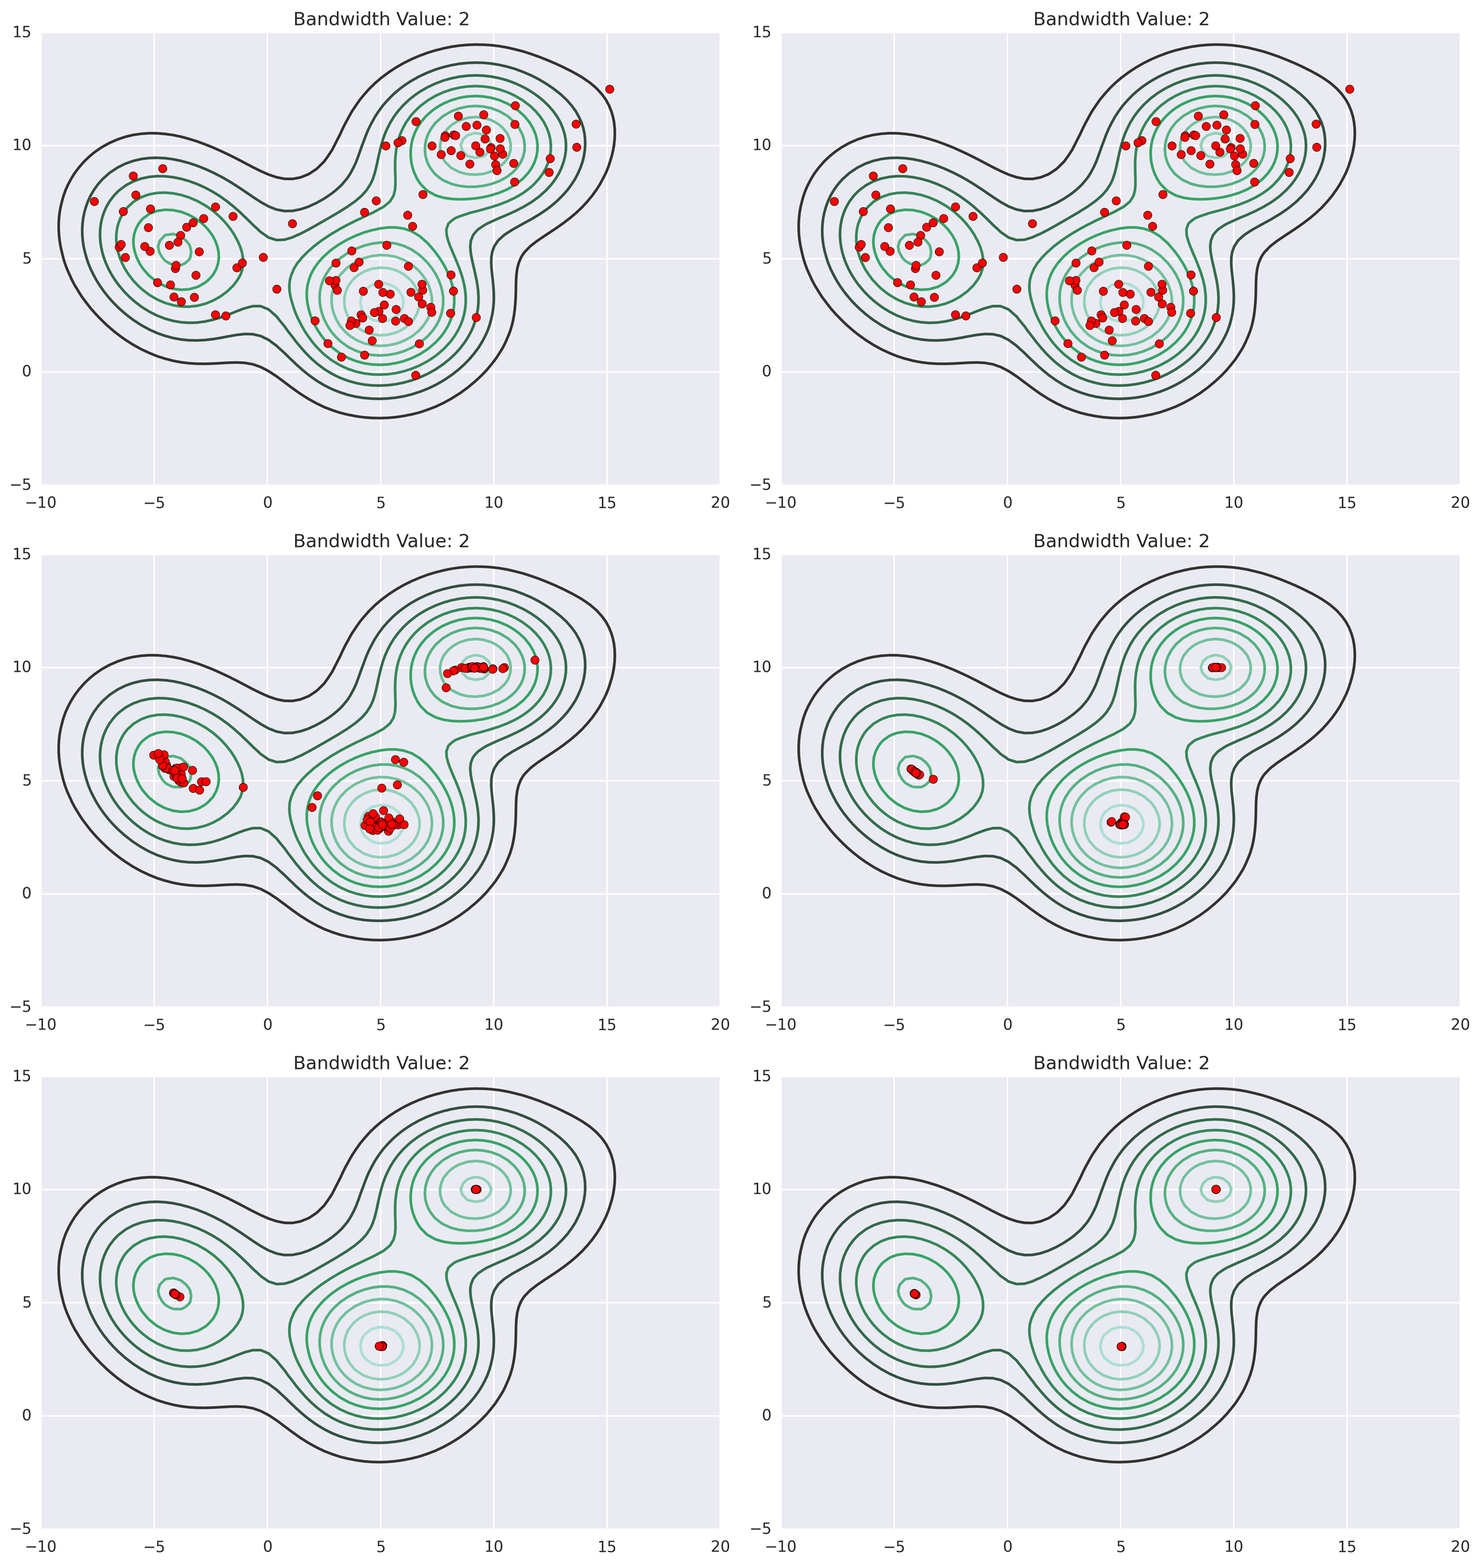
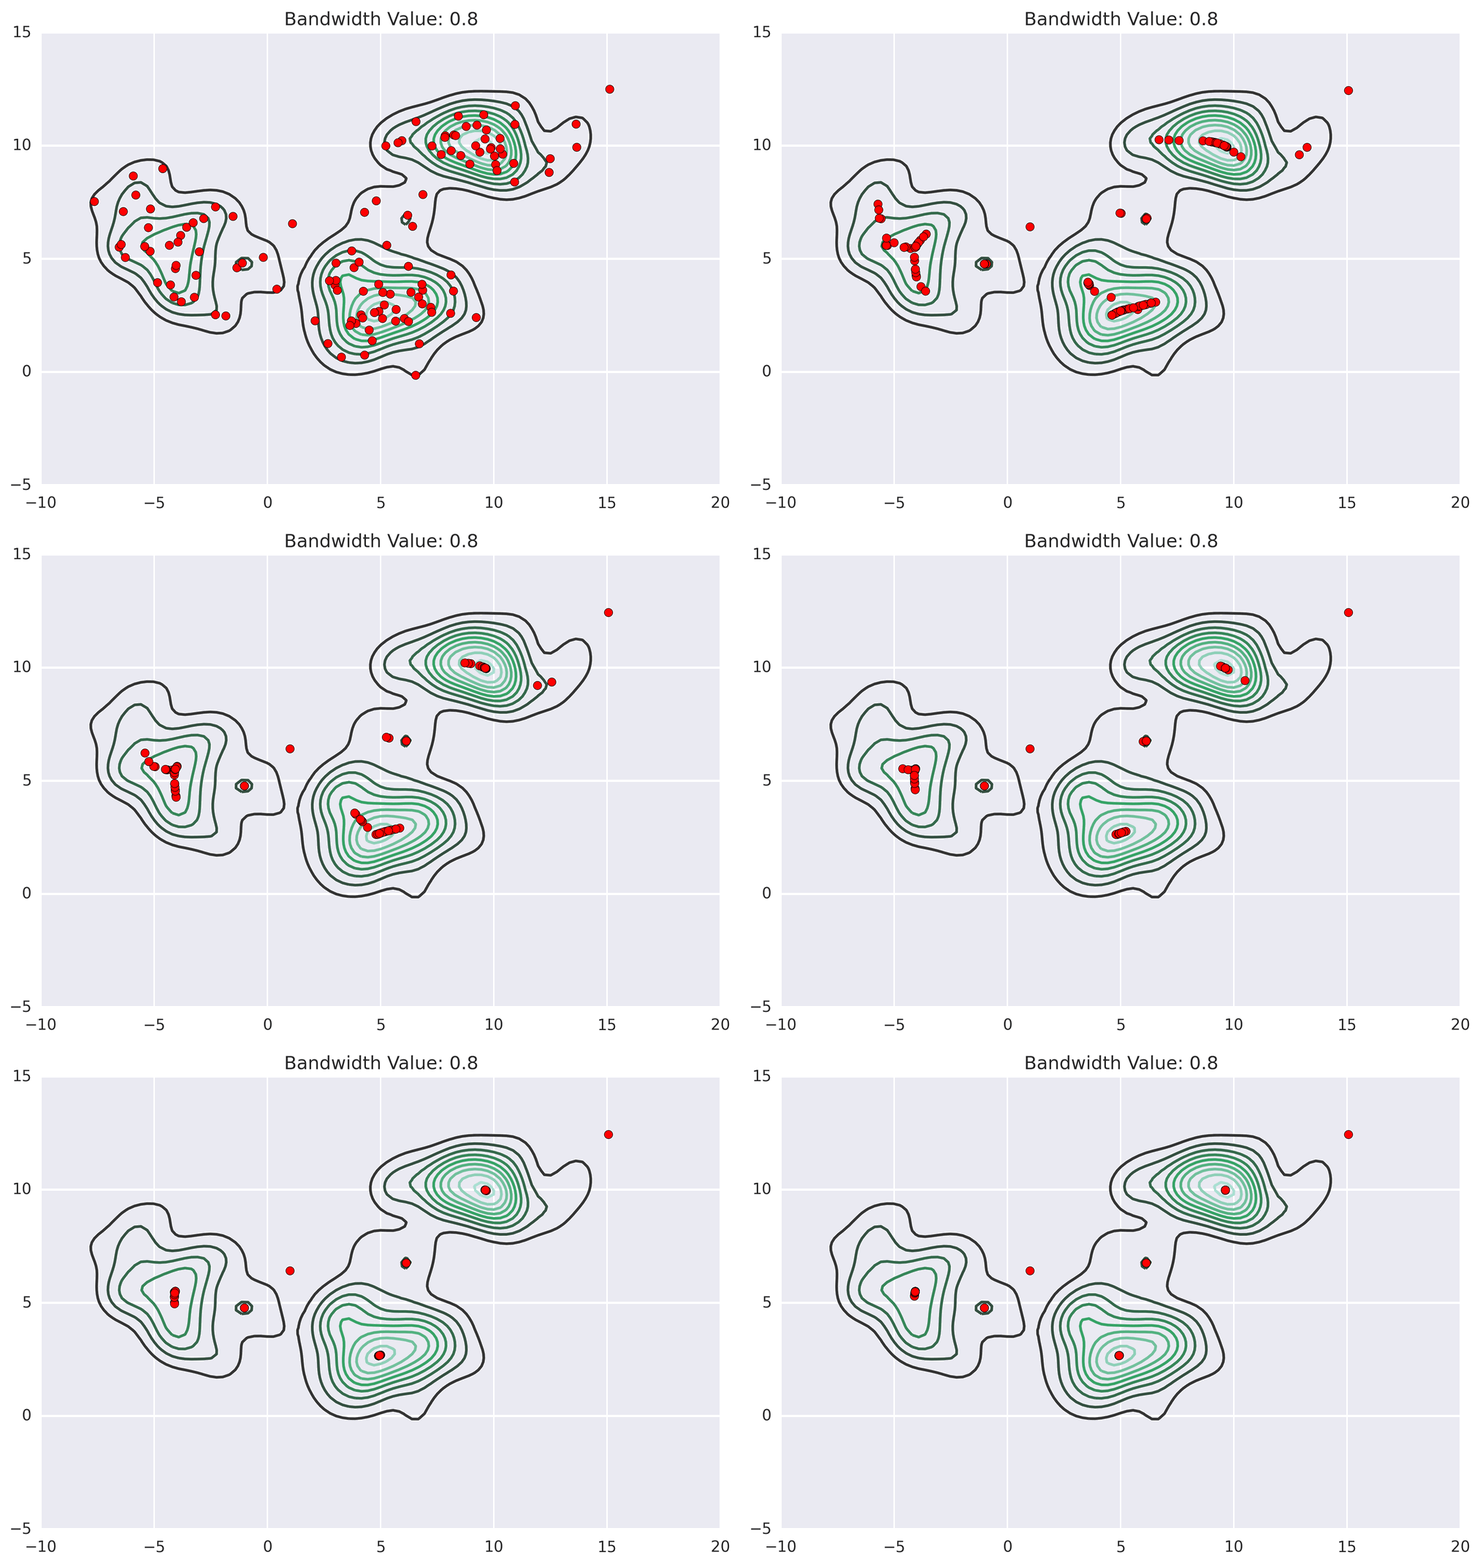
Mean shift exploits this KDE idea by imagining what the points would do if they all climbed up hill to the nearest peak on the KDE surface. It does so by iteratively shifting each point uphill until it reaches a peak[ref] .
 Points climb to the nearest hill.
 Points climb to the nearest hill.
When?
- Image processing and computer vision.
- Image Segmentation Application[ref] .
Pros & Cons
- Pros: Non-Parametric Density Estimation.
- Cons: It’s computationally expensive O(n²) [ref] .
Code?
from sklearn.cluster import MeanShift
clustering = MeanShift(bandwidth=2).fit(X)
clustering.fit(X)
clustering.predict(X)
# or
clustering.fit_predict(X)
Components:
clustering.labels_: clusters’ labels.
Usage example
- Used to determined windows of time in time series data.
References
- Saravanan Thirumuruganathan – Introduction To Mean Shift Algorithm.
- Geeksforgeeks – Mean-Shift clustering.
- R.Collins – Mean-Shift tracking.
- Matt Nedrich – Mean Shift Clustering.
