Last modified on 01 Oct 2021.
What’s the idea of Decision Tree Regression?
The basic intuition behind a decision tree is to map out all possible decision paths in the form of a tree. It can be used for classification (note) and regression. In this post, let’s try to understand the regression.
DT Regression is similar to DT Classification, however we use Mean Square Error (MSE, default) or Mean Absolute Error (MAE) instead of cross-entropy or Gini impurity to determine splits.
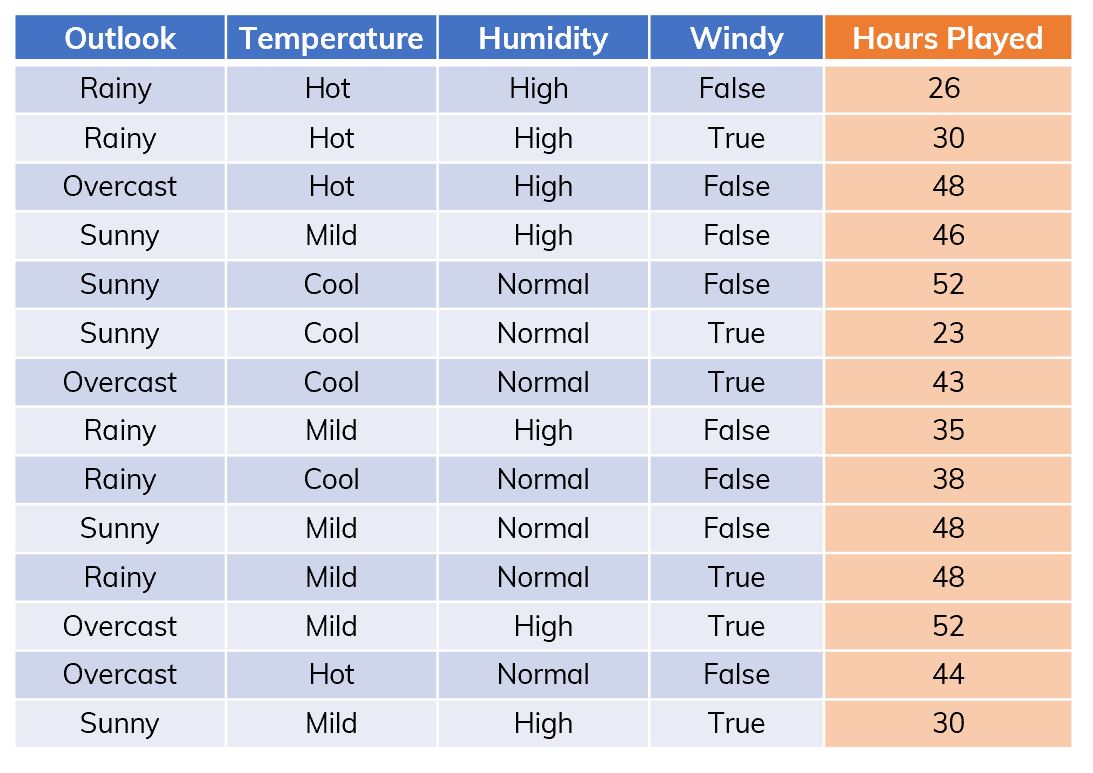
Suppose that we have a dataset like in the figure below,
 An example of dataset .
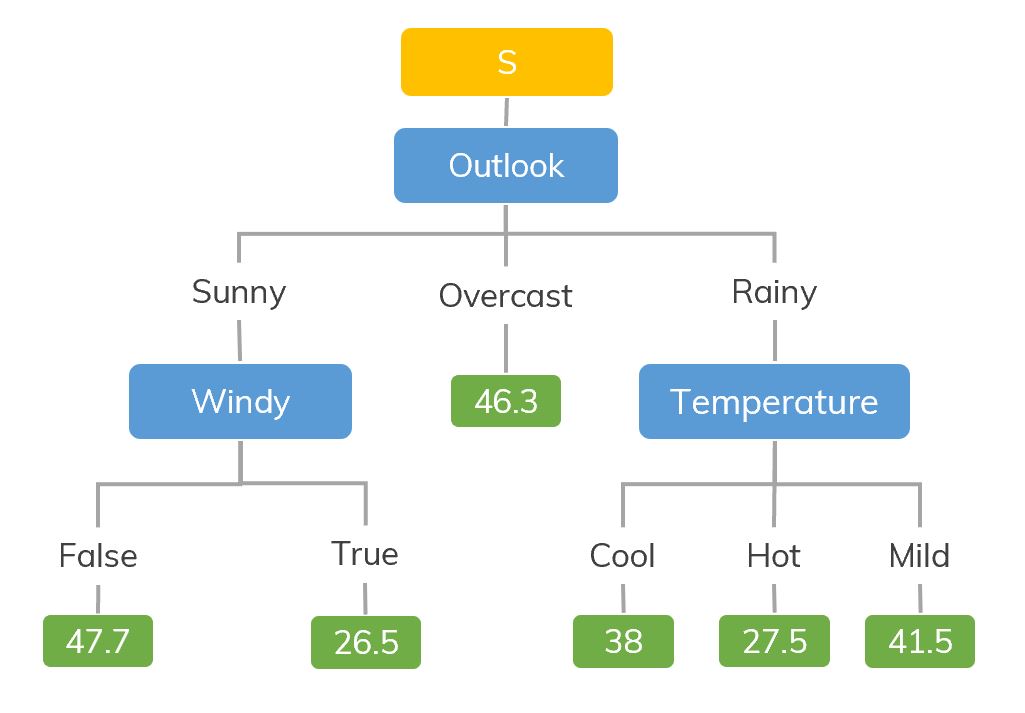
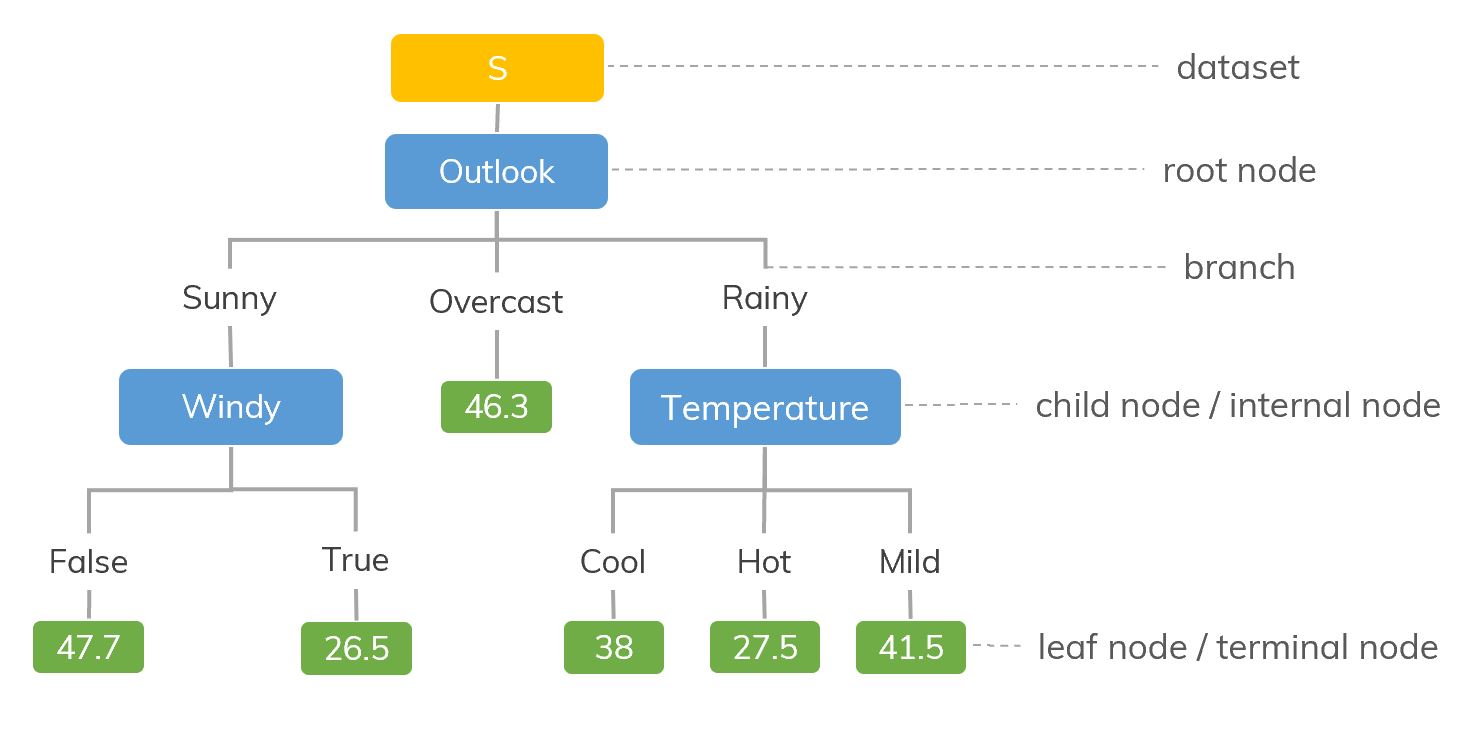
 A decision tree we want.
Some basic concepts

- Splitting: It is a process of dividing a node into two or more sub-nodes.
- Pruning: When we remove sub-nodes of a decision node, this process is called pruning.
- Parent node and Child Node: A node, which is divided into sub-nodes is called parent node of sub-nodes where as sub-nodes are the child of parent node.
Other aspects of decision tree algorithm, check this note.
Looking for an example like in the post of decision tree classifier? Check this! Below are a short algorithm,
-
Calculate the Standard Deviation () of the current node (let’s say , parent node) by using MSE or MAE,
where the target values (Hours Played in the above example), is the mean value and is the number of examples in this node.
-
Check the stopping conditions (we don’t need to make any split at this node) to stop the split and this node becomes a leaf node. Otherwise, go to step 3.
- The minimum number of samples required to split an internal node, use
min_samples_splitin scikit-learn. - The maximum depth of the tree, use
max_depthin scikit-learn. - A node will be split if this split induces a decrease of the impurity greater than or equal to this value, use
min_impurity_decreasein scikit-learn. - Its coefficient of variation () is less than a certain threshold.
- The minimum number of samples required to split an internal node, use
-
Calculate the Standard Deviation Reduction (SDR) after splitting node on each attribute (for example, consider attribute ). The attribute w.r.t. the biggest SDR will be chosen!
where number of different properties in and is the propability of property in . Note that, means the SD of node which is also a child of node .
-
After splitting, we have new child nodes. Each of them becomes a new parent node in the next step. Go back to step 1.
Using Decision Tree Regression with Scikit-learn
Load and create
Load the library,
from sklearn.tree import DecisionTreeRegressor
Create a decision tree (other parameters):
# mean squared error (default)
reg = DecisionTreeRegressor() # criterion='mse'
# mean absolute error
reg = DecisionTreeRegressor(criterion='mae')
An example,
from sklearn import tree
X = [[0, 0], [2, 2]]
y = [0.5, 2.5]
reg = tree.DecisionTreeRegressor()
reg = reg.fit(X, y) # train
array([0.5])
Plot and save plots
Plot the tree (You may need to install Graphviz first. Don’t forget to add its installed folder to $path),
from IPython.display import Image
import pydotplus
dot_data = tree.export_graphviz(reg, out_file=None,
                                rounded=True,
                                filled=True)
graph = pydotplus.graph_from_dot_data(dot_data)
Image(graph.create_png())

Save the tree (follows the codes in “plot the tree”)
graph.write_pdf("tree.pdf")   # to pdf
graph.write_png("thi.png")    # to png
References
- Skikit-learn. Decision Tree Regressor official doc.
- Saed Sayad. Decision Tree - Regression.
