Last modified on 01 Oct 2021.
Temporary file and directory
Using tempfile. A file/directory will be created to work. Close files, files are deleted!
import tempfile

# create tmp file and write some data
fp = tempfile.TemporaryFile()
fp.write(b'Hello world!')

# read data from file
fp.seek(0)
fp.read()

# close the file, it'll be removed!
fp.close()
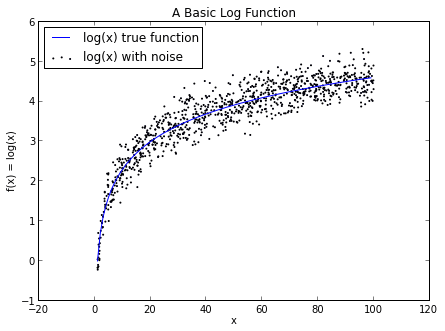
Create some fake data w.r.t. a function
# f(x) = log(x)
import numpy as np
x = np.random.uniform(1, 100, 1000)
y = np.log(x) + np.random.normal(0, .3, 1000)
plt.plot(x,y, '.')
plt.plot(x, np.log(x), '.')

Time Series data
Simple range of time
Read more about date_range(), there are other options, for example, adding timezones.
import numpy as np
import pandas as pd

df = dict({
    'date': pd.date_range('1/1/2020', periods=4, freq='T', tz='Europe/Paris'),
    'val1': np.arange(10,10+per,1),
    'var2': np.arange(20,20+per,1),
    'var3': np.arange(30,30+per,1)
})
df = pd.DataFrame(df)
| date | val1 | var2 | var3 | |
|---|---|---|---|---|
| 0 | 2020-01-01 00:00:00+01:00 | 10 | 20 | 30 |
| 1 | 2020-01-01 00:01:00+01:00 | 11 | 21 | 31 |
| 2 | 2020-01-01 00:02:00+01:00 | 12 | 22 | 32 |
| 3 | 2020-01-01 00:03:00+01:00 | 13 | 23 | 33 |
Manually
With timezone (manually)
df = pd.DataFrame({'timestamp': ['2019-01-31T16:47:00+01:00', '2019-01-31T16:48:00+02:00',
                                 '2019-01-31T16:49:00+02:00', '2019-01-31T16:50:00+01:00']})
With time gaps
Different time gaps (time steps),
import pandas as pd
import numpy as np
from pandas.tseries.frequencies import to_offset
def generate_sample(starting_date, periods=None, gaps=None, freq="1T", n_vars=1):
    """
    General a sample time series dataframe with different periods and time steps.

    Parameters:
    -----------
    starting_date: datetime-like, str, int, float
        Starting date of the data.
    periods: array, list of int
        The list of (different) periods to generate.
    gaps: array, list of numbers, optional
        The list of gaps (between periods).
    freq: frequency strings
        The most popular time steps.
    n_vars: int
        Number of columns of variables.
    """
    df = pd.DataFrame()
    periods = list(periods)
    for idx, _ in enumerate(periods):
        per = periods[idx]
        if gaps is not None:
            gaps = list(gaps)
            gap = gaps[idx]
            starting_date = str(pd.Timestamp(starting_date) + pd.to_timedelta(to_offset(freq))*gap)
        else:
            starting_date = str(pd.Timestamp(starting_date))

        df_tmp = dict({'date': pd.date_range(starting_date, periods=per, freq=freq)})
        df_tmp = pd.DataFrame(df_tmp)
        df = pd.concat([df, df_tmp], ignore_index=True, sort=False)
        starting_date = str(df_tmp.date.iloc[-1])

    for i_var in range(n_vars):
        df['var'+str(i_var)] = np.arange(i_var*10, i_var*10+sum(periods))

    df = df.infer_objects()
    return df
df = generate_sample(starting_date='2020-01-01',
                     periods=[3, 2],
                     gaps=[0, 5],
                     freq='1T',
                     n_vars=5)
| date | var0 | var1 | var2 | var3 | var4 | |
|---|---|---|---|---|---|---|
| 0 | 2020-01-01 00:00:00 | 0 | 10 | 20 | 30 | 40 |
| 1 | 2020-01-01 00:01:00 | 1 | 11 | 21 | 31 | 41 |
| 2 | 2020-01-01 00:02:00 | 2 | 12 | 22 | 32 | 42 |
| 3 | 2020-01-01 00:07:00 | 3 | 13 | 23 | 33 | 43 |
| 4 | 2020-01-01 00:08:00 | 4 | 14 | 24 | 34 | 44 |
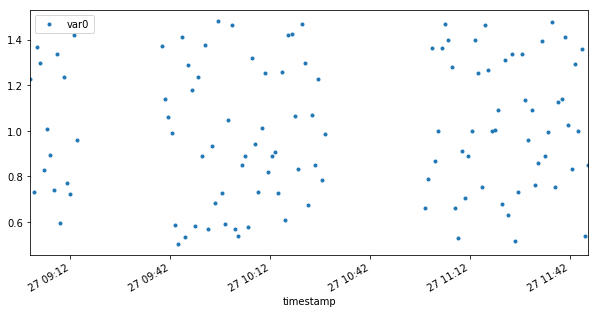
With windows of time
import pandas as pd
import numpy as np
from pandas.tseries.frequencies import to_offset
def generate_ts_data_window(ts_start='2020-03-27', n_windows=3, n_elements=20, regular=True,
                            random_seed=None, dif_size=False, gaps='auto', n_point_spec='full', freq='T', n_vars=1):
    """
    General a sample time series dataframe with already-shaped windows.

    Parameters:
    -----------
    ts_start: datetime-like, str, int, float
        Starting date of the data.
    n_windows: int
        The number of windows to be generated.
    n_elements: int
        Max number of elements in each window.
    regular: boolean, default=True
        The regularity of the distribution in each window.
    random_seed: int, default=None
        Seed the generator for generating the same data in every test.
        If `None`, the choices in `n_elements` (when `dif_size=True`), `regular=True`
        are chosen randomly.
    dif_size: boolean
        Windows with different sizes?
    gaps: 'auto' or lst
        If 'auto', the gaps between windows are chosen equally.
        Otherwise, you have to put the list of percentage (greater than 1) being plus to
        `n_elements` (minimum window' size).
        Note that, the length of this list is equal to `n_windows-1`.
    n_point_spec: 'full' or int, default='full'
        The number of points in the special window. If 'full', its number of elements
        is generated as others'.
    freq: frequency strings, default='T'
        The most popular time steps.
    n_vars: int
        Number of variable columns.
    """

    df = pd.DataFrame()

    gap = 0
    np.random.seed(random_seed)

    # choose the special window
    spec_win = np.random.randint(0, n_windows)

    for w in range(n_windows):
        n_elements_new = n_elements
        if (n_point_spec != 'full') and (w == spec_win):
            n_elements_new = n_point_spec
        elif dif_size:
            # add randomly more data points
            n_elements_new = int(n_elements + np.random.randint(1, 100 + 1)/100*n_elements)
        ts_start = str(pd.Timestamp(ts_start) + pd.to_timedelta(to_offset(freq))*gap)
        df_tmp = dict({'timestamp': pd.date_range(ts_start, periods=n_elements_new, freq=freq)})
        for i_var in range(n_vars):
            df_tmp['var'+str(i_var)] = 0.5 + np.random.random_sample((n_elements_new,))
        df_tmp = pd.DataFrame(df_tmp)
        if not regular:
            # remove randomly 0% - 50% data points from a window
            frac = 0.5+0.5*np.random.random()
            df_tmp = df_tmp.sample(frac=frac, axis=0)
        df = pd.concat([df, df_tmp], ignore_index=True, sort=False)
        ts_start = str(df_tmp['timestamp'].iloc[-1])

        gap = n_elements / 2 # default: gap=50% length of n_elements
        if (gaps != 'auto') and (w != n_windows-1):
            gap = n_elements / 2 + gaps[w]*n_elements/100
        print(gap)

    df = df.infer_objects()
    return df
df = generate_ts_data_window(n_windows=3,
                            regular=True,
                            n_elements=50,
                            dif_size=False,
                            n_point_spec=15,
                            gaps=[1, 10])
df.set_index('timestamp').plot(figsize=(10,5), style='.')

Stationary TS with noise
Random choose the positions of anomal group + random choose the number of points in each group.
# CREATE A SAMPLE OF STATIONARY TIME SERIES
np.random.seed(124)
ts_start = '2020-01-01'
periods = 500
num_group_noise = 4
max_point_each_group_noise = 50
max_noise = 7

date = pd.date_range(ts_start, periods=periods, freq='D')
data = np.random.randn(periods)
# add noises
noise_num_pts = np.random.randint(5,max_point_each_group_noise, (num_group_noise,)) # number of points at each position of noise
noise_pos = np.random.choice(periods, num_group_noise) # number of position having noises
list_of_idx_noise = []
for idx, pos in enumerate(noise_pos):
    if periods - pos > max_point_each_group_noise:

#         noises = (-1)**(idx)*max_noise + 0.5*np.random.randn(noise_num_pts[idx]) # 2 sides
        noises = max_noise + 0.5*np.random.randn(noise_num_pts[idx]) # 1 sides

        data[pos:pos+noise_num_pts[idx]] = noises
        list_of_idx_noise += [*range(pos, pos+noise_num_pts[idx], 1)]

df = pd.DataFrame({'date': date, 'value': data})
df = df.set_index('date')

list_of_idx_noise = list(set(list_of_idx_noise))
df_out = df.iloc[list_of_idx_noise] # df of noises
# PLOT DATA WITH ANOMALIES
def plot_anomalies(df, df_anomalies=None, idx_anomalies=None, title=None):
    if not idx_anomalies:
        idx_anomalies = df_anomalies['ts_start'].astype('datetime64[ms]').to_list()
    plt.figure(figsize=(20, 5))
    plt.scatter(df.index, df.value)
    plt.scatter(idx_anomalies, df.loc[idx_anomalies], c='r')
    plt.xticks(fontsize=14)
    plt.yticks(fontsize=14)
    plt.xlabel('date', fontsize=14)
    plt.ylabel('value', fontsize=14)
    if title:
        plt.title(title, fontsize=14)
